Web Page Features
There are three ways to monitor, and to a limited extent, control your FireBoard Spark thermometer:
via the unit's display, via the Fireboard App, and via the web
using a browser. You have already seen what the display looks like and a little of what the App
looks like in previous sections (and you'll see more about the App in a following section), so let's take a quick look
at the web interface.
The web interface can be found at fireboard.io/accounts/login/.
We'll show you some of the basic features here, but feel free to go explore on your own. Even though you may not
want to use the web interface as your main method, there are a few options/features that exist only in the web
interface (such as accessing your raw data).
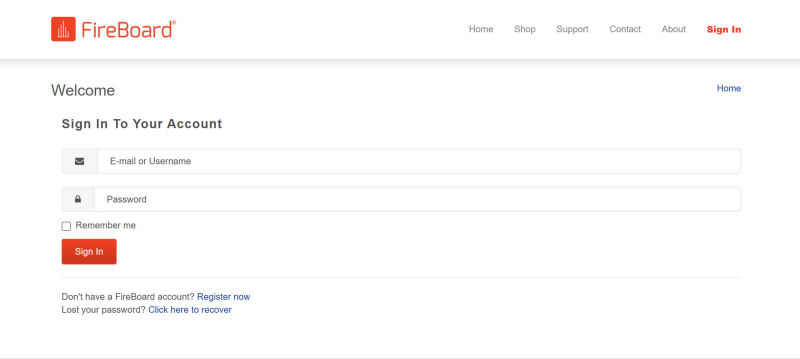
When you visit the FireBoard.io website, you will first be asked to log in.
(If you don't have an account, the Login screen gives you the opportunity to create a new account.)
Upon logging in you are taken to the Dashboard showing its "Realtime View" of either your current or your most
recent session:
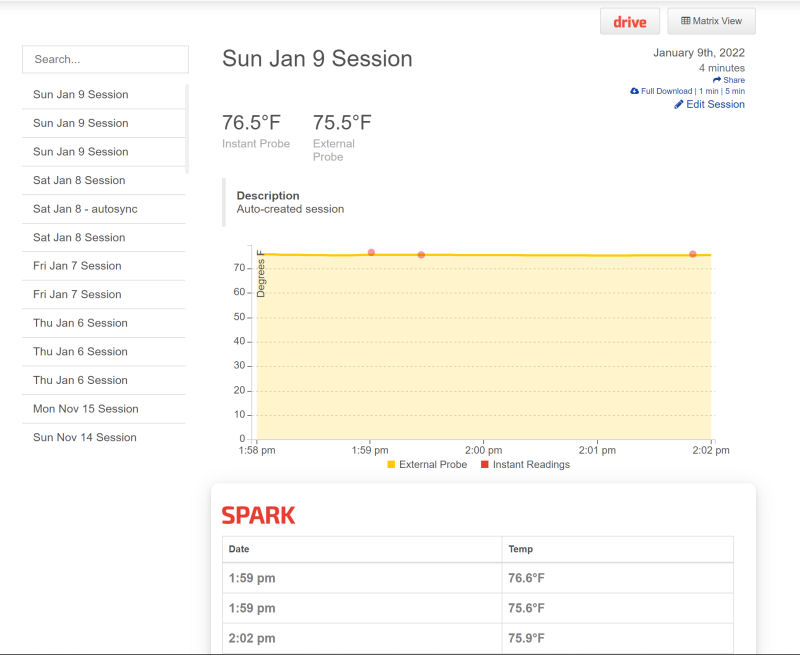
Things you can do from the Dashboard:
- Select a session to view from the column on the left.
- If viewing an active session, you can see the temperature for each channel.
- See a graph of all active channels.
- Edit the session, changing it's title and adding notes.
- Download the raw temperature data for the session.
- Share your session via email, Facebook, Twitter or Google.
- Switch to the Drive view (only if you have a Fireboard 2 Drive also active).
- View temperature readings from the instant-read probe (orange dots on the graph and the table below the graph).
Clicking on the Matrix View button at the top gives you this matrix view of the channels and data:
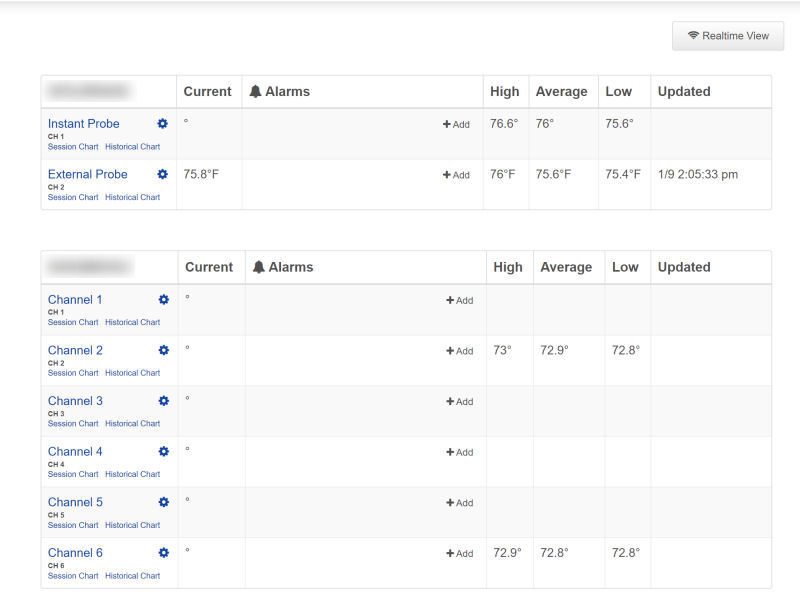
A few things you can do from the Matrix view:
- Rename a channel or designate a channel as a Failsafe Monitor.
- Add, edit and delete alarms for each channel.
Access To Raw Data
When you are viewing the "Realtime View", you have the option of accessing the raw data for your session. You can
click on either "Full Download", "1 min", or "5 min" to download a .CSV file containing the raw data:
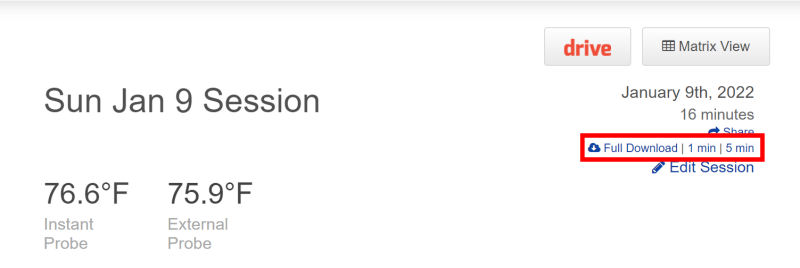
- Full Download: This option downloads a .CSV file that contains all the data
captured.
- 1 min: This option downloads a .CSV file that contains readings taken at
1-minute intervals.
- 5 min: This option downloads a .CSV file that contains readings taken at
5-minute intervals.
Here's what a portion of the "Full Download" .CSV file for the Spark looks like if you open it with Excel:
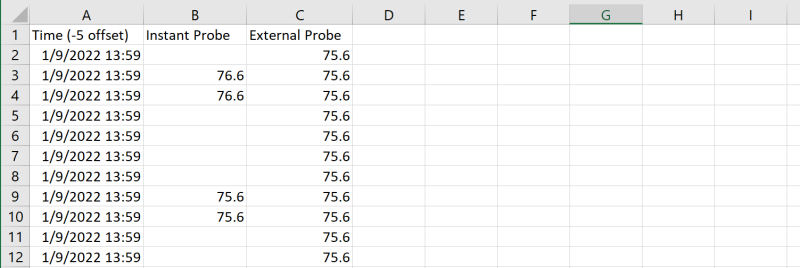
Needless to say, had we plugged in more temperature probes, there would have been additional columns, one for each
additional probe.
A few comments on the contents of the spreadsheet:
- Only the active channels are included.
- Generally speaking, entries in the "Full Download" spreadsheet are only created when the value for one
of the channels changes, not at fixed intervals. Entries for the instant-read probe are created each
time you press the Function Button on the Spark. Entries for the 1 and 5-minute spreadsheets are
created at fixed 1 and 5-minute intervals.
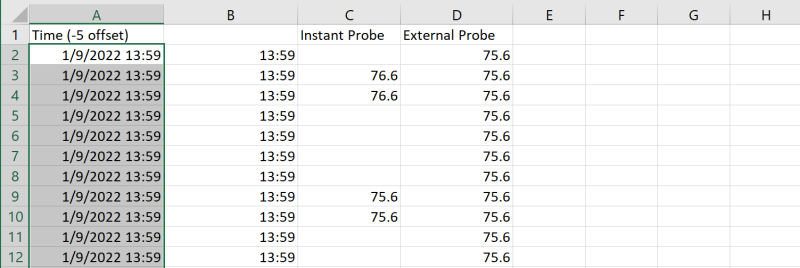
- The "Time" column actually contains both date and time values, which requires some trickery to extract only the time.
You can create a blank column and then use this formula to convert the date/time cell into just the time:
=TIME(HOUR(A1),MINUTE(A1),SECOND(A1))
Then use the "Format Cell" command to format your new cells as hh:mm. Here's what it looks like:
←Previous Page
Next Page→
nakedwhiz.com
Home
Search Our Site
Email The Whiz
Listen To Whizcast
Whizlog
Buy Whiz Gear
Privacy Policy
All Contents ©2001, 2023 The Naked Whiz
International Association of Fire Safety Science member #1604
You can support this website by shopping at
The Naked Whiz Website Store and
Amazon.com
 |
You can make donations to The Naked Whiz
Website using Bitcoin! Scan the QR code at
left or copy and paste our wallet ID:
1Bt4vjU9PUQNVvEZZq6ik6jWYr6nr4rJRp
|
 |
|
|